Step by Step Simple Linear Regression Analysis Using SPSS
Step by Step Simple Linear Regression Analysis Using SPSS | Regression analysis to determine the effect between the variables studied. Variables that affect so called independent variables, while the variable that is affected is called the dependent variable. The independent variable is marked with the letter X, while the dependent variable is marked with the letter Y.
Regression analysis based on the number of independent variables divided into two, namely the simple linear regression analysis and multiple linear regression analysis. Simple linear regression analysis to determine the effect of the independent variables on the dependent variable.
Basic Decision Making in Simple Linear Regression Analysis
- If the Sig. <0.05, significant effect of independent variables on the dependent variable
- If the Sig. > 0.05, then the independent variable has no significant effect on the dependent variable
Case in Simple Linear Regression Analysis
A company manager wants to know whether there is an influence on Employee Performance Competence. In this case the competence is the independent variable, while the performance is the dependent variable. Furthermore, the manager of Competency and Performance collect data from a sample of 40 employees. The research data as shown below.

Download the complete data
Step by Step Simple Linear Regression Analysis Using SPSS
1. Turn on the SPSS program and select the Variable View. Furthermore, definitions study variables so that the results fit the picture below.

2. Then, click the Data View and enter the data Competency and Performance.

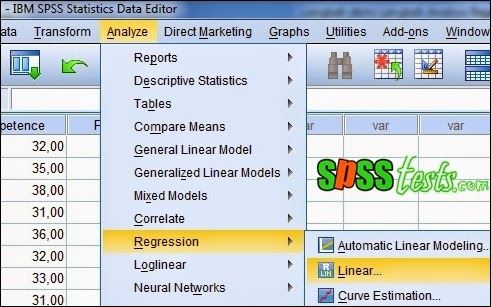
3. Next, from the SPSS menu click Analyze - Regression - linear

4. Will display box Linear Regression, then insert into the box Independent(s) Competence, then insert into the box Dependent Performance

5. The last step clicks Ok, after which it will appear SPSS output, as follows:
(Output Model Summary)

(Output Coefficients a)

Interpretation of Results Output Simple Linear Regression Analysis
(Output Model Summary)
In this section display the value of R = 0.692 and the coefficient of determination (Rsquare) amounted to 0,478. This suggests the notion that performance (Y) is influenced by 47.8% by Competence (X), while the rest (100% -47.8% = 52.2%) is explained by other causes.
(Output Coefficients a)
In this section displayed a significance value of 0.000 <0.05, then the appropriate basis for decision making in the regression analysis can be concluded that the Competence significant effect on employee performance. Thus, increasing the competence of a person it will also improve performance.
Next: How Multiple Linear Regression Analysis Using SPSS
[Keywords: Step-by-Step Simple Linear Regression Analysis Using SPSS | Simple Linear Regression Testing Using SPSS | Tutorial Simple Linear Regression with SPSS Software Complete]
[Image: Data SPSS Version 21]
[Source: Summarized from various sources]

simple but so helpful presentation of linear regression in SPSS, Thank you.
ReplyDelete