Heteroscedasticity Chart Scatterplot Test Using SPSS
Heteroscedasticity Chart Scatterplot Test Using SPSS | Heteroscedasticity test is part of the classical assumption test in the regression model. To detect the presence or absence of heteroskedastisitas in a data, can be done in several ways, one of them is by looking at the scatterplot graph on SPSS output.
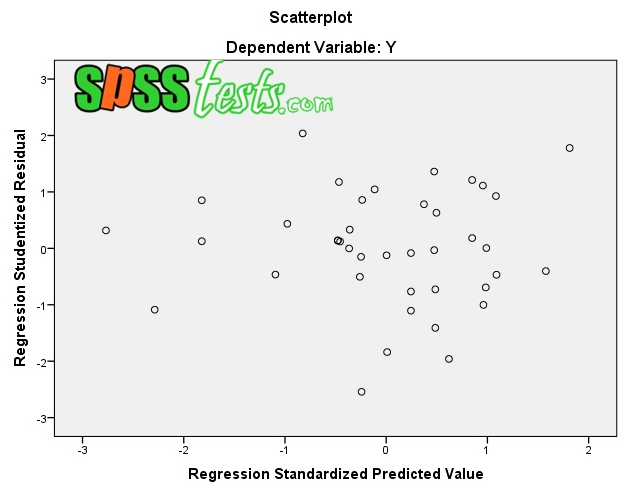
The working principle of heteroscedasticity test with this method is to see the Scatterplot graph between the predictive value of the independent variable that is ZPRED with the residue of SRESID.
BASIC DECISION MAKING IN THE SCATTERPLOT GRAPHIC HETEROSKEDASTICITY TEST
- If there is a particular pattern in the SPSS Scatterplot Graph, such as the points that form a regular pattern, it can be concluded that there has been a problem of heteroscedasticity.
- Conversely, if there is no clear pattern, and spreading dots, then the indication is no heteroscedasticity problem.
EXAMPLE OF CASES IN THE HETEROSKEDASTICITE TEST
For example, I have a regression model that is: "The effect of X1 and X2 on Y". For the data above regression model can be seen in the picture below.

Description: Number of respondents amounted to = 40 people. As an exercise you can download the above data in the format excel | DOWNLOAD COMPLETE DATA
TEST STEPS HETEROSKEDASTICITY GRAPHS SCATTERPLOT SPSS
1. Activate SPSS program, then click Variable View, then on the Name write X1, X2, and Y.

2. Then click Data View, then enter the value for each variable.

3. Next step click Analyze - Regression - Linear ...

4. The new dialog box appears Linear Regression, enter the Y variable into the Dependent box, then insert the variables X1 and X2 into the box Independent (s)

5. Next select Plots, a dialog box will appear with the name Linear Regression: Plots, then enter the variable * SRESID into the box Y. and enter the variable * ZPRED to the X box, then click Continue

6. Finally click Ok

INTERPRETATION OF HETEROSKEDASTICITY OUTPUT WITH SCATTERPLOT GRAPH
Based on the Scatterplot ouput above, it appears that the spots are diffused and do not form a clear specific pattern. So it can be concluded that the regression model does not occur heteroskedastisitas problem.
Next: Test Heteroskedasticity Glejser Using SPSS
[Keywords: Heteroskedasticity Test with SPSS Scatterplot Chart | Step by Step Heteroskedastisitas Graph Test Scatterplot with SPSS 21 | Symptoms of Heteroskidasticity with Charts of Scatterplot Graph on Regression Model]

it is a very important flash points that indicates how to test. In addition to this, I would like to request that test homogeneity using spss,white test
ReplyDeletegood ideas..thank you
Delete